雅思作文考试中,小作文会出现数据类图表和非数据类图表,在分析数据类图表的时候,学生们的心路历程往往如下:什么!今 天的图表数据竟然这么多,完蛋了———这么多的数据,我究竟写啥?(5分钟过去了。。。)————没时间了,看到啥就写啥吧(于是奋笔疾书。。)

宏观概括 (overview)
主体段1(Topic sentence 1)
主体段2(Topic sentence 2)
主体段3(Topic sentence 3)
宏观概括
主体段
主体段的功能实际上是为了宏观概括服务的, 我们需要在主体段进一步解释宏观概括的内容, 也就是为什么这些数据呈现了相似的趋势或者是不同的趋势, 而在每个主体段中,都需要出现一个topic sentence, 然后后面加上数据来支撑这个topic sentence。
不知道看到这里,大家能理解吗?如果觉得比较抽象,那就让我们结合题目一起来看看究竟如何运用吧。

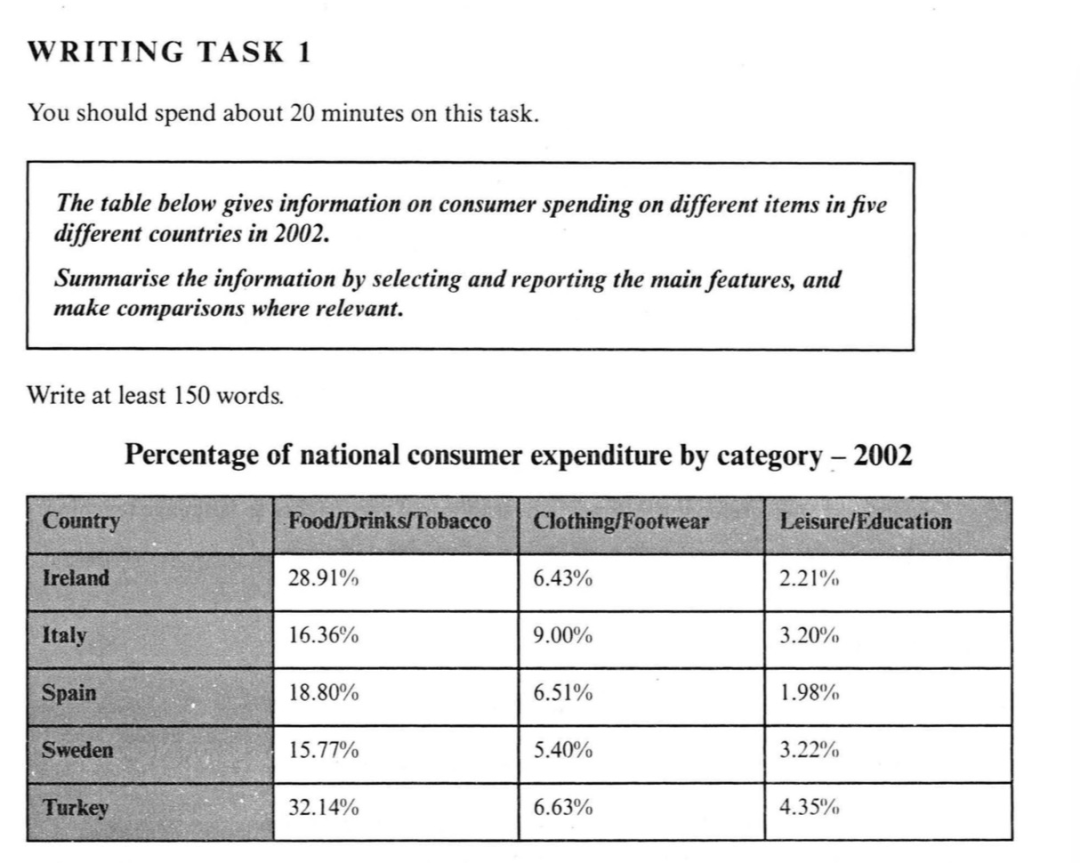
C7T1的小作文,讲的是五个国 家的消费者在三个不同类别上的花销情况。
尽管数据有15个之多,但是如果我们去分析这些数据呈现的是相似性还是差异性,我们还是能够比较容易的发现是相似性,而原因是
1. 五个国 家的消费者在三个类别中,都把更多的花销花在了food, drinks and tobacco 上了。
2. 相较于在food, drinks and tobacco 上面的花销, 大家花在clothing and footwear 上面的钱少的多的多。
3. 在leisure 和education 上面花的钱都是在三个类别中少的。
于是我们可以把宏观概括以及主体段的topic sentence顺利的书写出来了。
Overview:
Overall, the pattern of consumer spending on three categories showed similarities in five countries.
Topic sentence 1:
The money spent on food, drinks and tobacco accounted for the largest percentage among three categories in all five countries. To be specific, (数据支撑)
Topic sentence 2:
compared with the large spending on food, drinks and tobacco, there was much less expenditure on clothing and footwear. In more detail (数据支撑)
Topic sentence 3:
Consumers in all five countries spent the least percentage of money on leisure and education among three categories. Specifically, (数据支撑)
是不是有找到一点感觉啦!那大家一起思考下面一道题吧(先思考再看参考答案哟)

Overview:
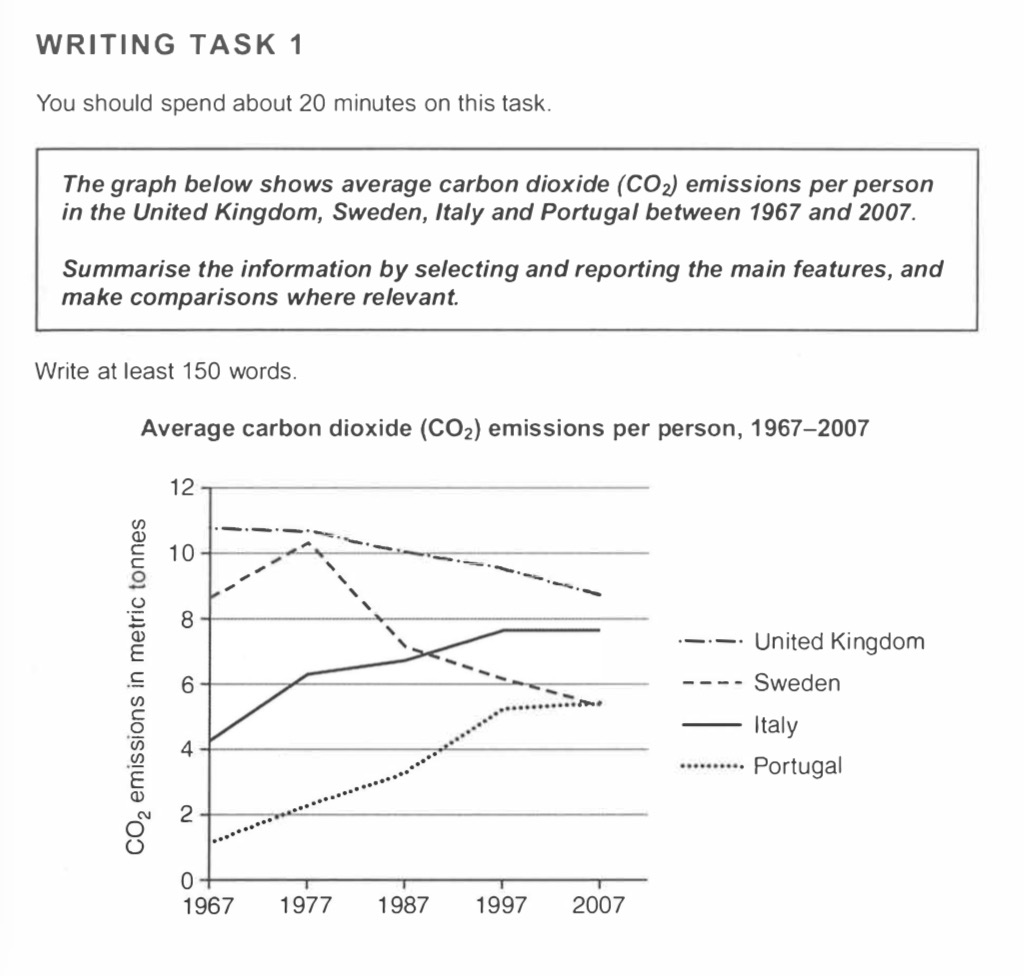
Overall, the average carbon dioxide emissions per person showed different trends in four different countries over the period.
Topic sentence 1:
The average carbon dioxide emissions per person showed a downward trend in the United Kingdom and Sweden in these 40 years. In more detail, ……
Topic sentence 2:
By contrast, there was an upward trend in the average carbon dioxide emissions per person in the other two nations during the same period. Specifically, ……